


After the ‘first look’ post earlier, I thought it might be worth the trouble to setup a couple small experiments to see about the differences quantitatively between Apple’s MacBookPro, iPhone and iPad.
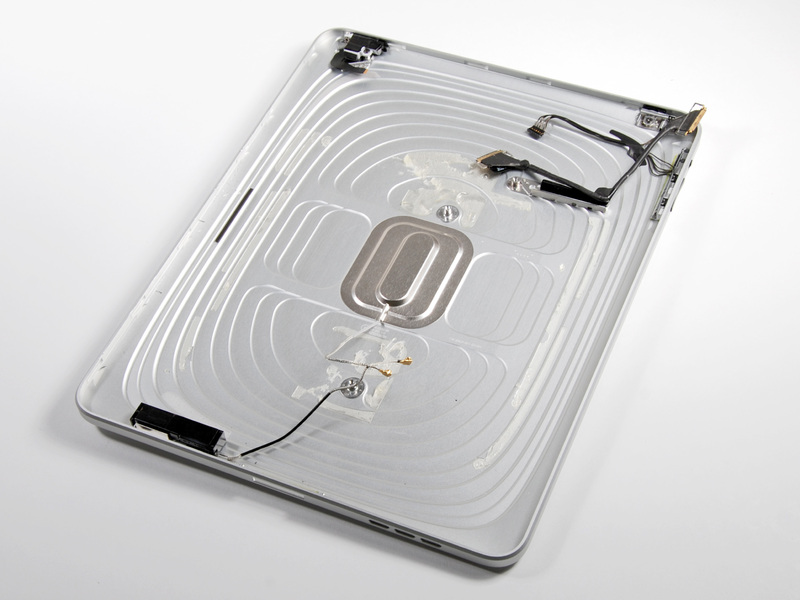
First about the iPad’s internal wireless setup. (photos come from iFixit.com) The system is using a Broadcom BCM4329XKUBG 802.11n WiFi + Bluetooth 2.1 + EDR and FM w/2 antenna leads – this small chip allows for multiple RF functions in one package. It is connected to an antenna mounted on the back of the iPad underneath the Apple logo (made of plastic, so easier to get RF signals through)
iPad Wi-Fi Components


Quantitative Wi-Fi Analysis
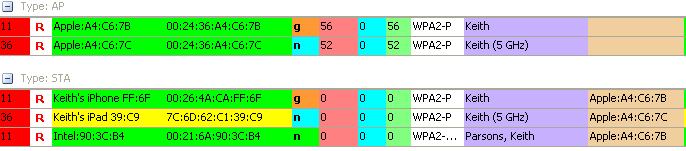
Let’s now look at some results from the small experiment. All three devices connected to a dual-band Access Point, at the same distance away from both the AP and the ‘sniffing’ NIC running AirMagnet WiFi Analyzer.

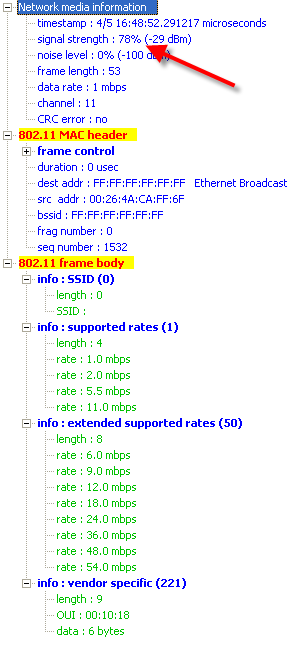
First the iPhone – it has an 802.11 b/g radio, supporting 2.4GHz only with 20MHz wide channels
Here is a sample of one of the Probe Requests from the iPhone 3GS. Note there is no ‘HT’ information, as you’d expect from a Legacy device. Also note RSSI – Received Signal Strength Indicator. This shows 2.4GHz signals are normally stronger than their 5GHz cousins. (In this case over -20dBm different)
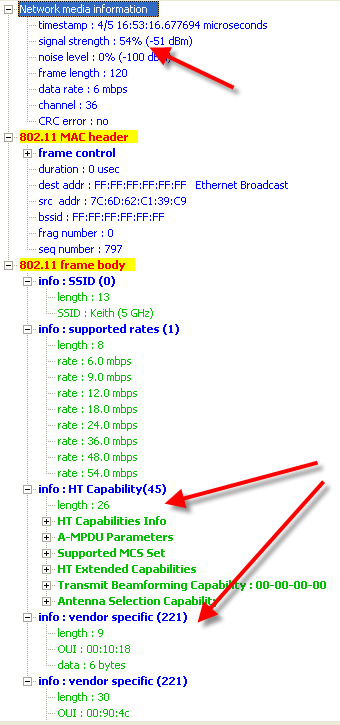
Next is the iPad – this new device has a dual-band, 802.11n NIC as noted above.
Here is the iPad’s Probe Request – note the added information about the iPad’s HT capabilities. Also note the lack of direct 40MHz support. I’m not sure if this is caused by the iPad itself, or just this current connection to the Access Point. You can also see only One Spatial Stream is supported.

iPhone Probe Request


And finally the MacBookPro as the ‘baseline’ device. This is a standard laptop, with built-in 802.11n supporting either 2.4GHz or 5GHz channels in 20/40 MHz configurations. For the test, I connected it to the 5GHz 802.11n SSID.


Bluetooth RF Analysis
I also did a bit of Spectrum Analysis using an AirMagnet Spectrum Expert system with the devices held about 12″ away from the receiving antenna.
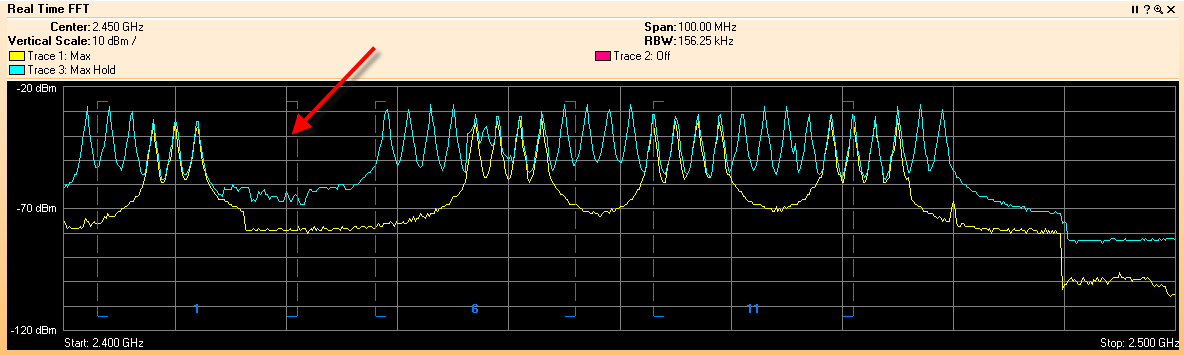

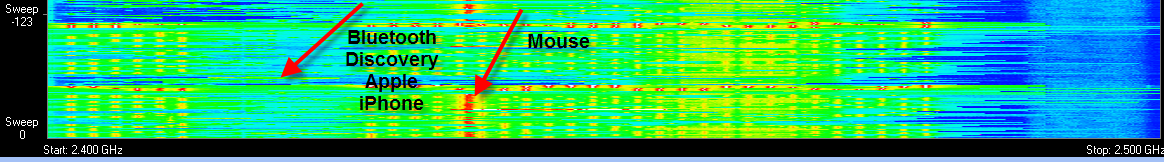

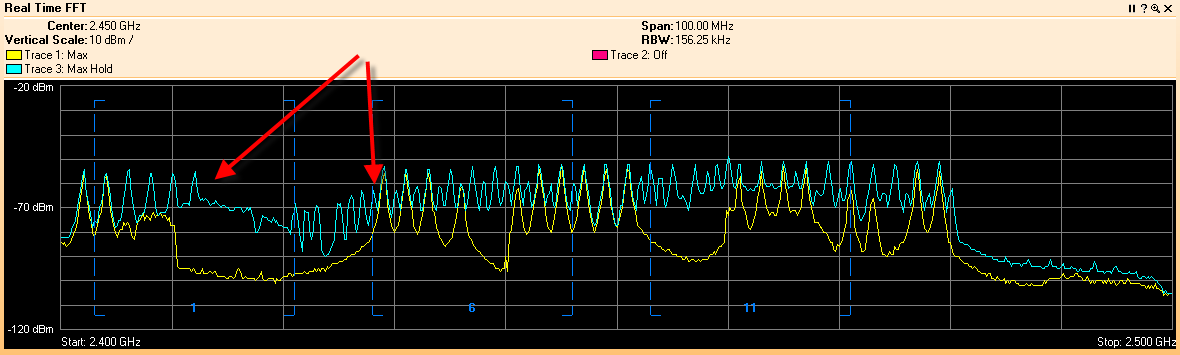
They look to both use the same Bluetooth chip manufacturer (note the ‘gap’ in Discovery Mode coverage on the left side of the screens) Different Bluetooth chips exhibit different Discovery Mode ‘gaps’ depending on chip manufacturer.

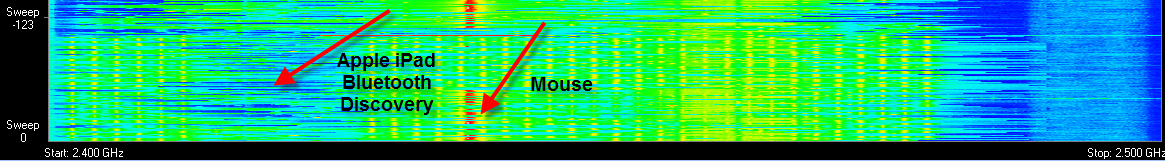

The iPhone’s Bluetooth is substantially stronger than the iPad. I don’t know ‘why’ this is, just noting the -25dB differential between them. Perhaps it’s caused by the differences in cases, or power settings.
Please leave comments and your ideas concerning this small experiment. I look forward to your feedback.
